Written by —

Written by —
A typical data platform or data warehouse includes a multitude of reliable data sources providing for example transactional information from sales and supply processes. The data flows from these systems through integration tools, either in batches or in streams. However, a common problem within data platform projects is that these data sources require supportive information or reference data and data platform teams need to maintain that information somewhere and offer a front-end solution for the business to make necessary updates.
For instance, a business might have a mapping table where suppliers are mapped to regions or assigned supply managers. Often, this information is held in Google Sheets or Excel files that are manually ingested into the data platform as CSV exports. Other use cases may involve changing calculation logic through configuration parameters passed through spreadsheets.
What's common in these use cases is that the data source, usually a spreadsheet, may undergo schema changes multiple times during its lifetime, making it difficult to:
- Maintain the integration
- Ensure proper data ownership to guarantee data quality
- Avoid incorrect data in terms of data types (e.g., numbers "5,0" and "5.0" behave differently in the database)
Spreadsheets are also challenging interfaces for end-users because they don't:
- Provide feedback for the end user on what data is already stored in the backend database
- Provide real-time changes (CRUD) to the backend database
So, what's the alternative? Allow me to reintroduce Streamlit and its latest feature, editable dataframes.
What is Streamlit?
In short, Streamlit is one of the most popular open-source Python libraries for creating interactive web-based applications, particularly for data visualization and machine learning. It enables you to quickly and easily build apps by writing simple Python scripts, which are automatically converted into a web application that can be shared with others. Streamlit has gained popularity since its launch as an open-source project in 2019. To learn more about Streamlit and Data Applications, check out my longer blog post with additional examples and a more in-depth introduction.
Click the image for an introduction to Streamlit & data applications on Snowflake with winter sports examples
What are editable dataframes?
Editable dataframes are a new feature in Streamlit that allows users to interactively edit data tables. Users can click on cells and edit their contents, add or delete rows, and copy-paste data from other sources. Key features include bulk editing, support for various data types, automatic input validation, and a rich editing experience with checkboxes and dropdowns. For more detailed information, check the original blog post from Streamlit.
Editable dataframes proved to be extremely useful when it was time to make predictions for the yearly IIHF Ice Hockey World Championship, also known as "MM-Kisaveikkaus," at Recordly. The rules of the game are simple: participants must predict the outcome of all games in the preliminary round. Scoring is based on correctly guessing the outcome and the winner with three (3) points awarded for the former and one (1) point for the latter. Additionally, in case of a tie, the employee who submitted their prediction first is given priority. The winner is the one who has guessed the most correct game scores.
Previously, as shown in the picture below, we used Google Sheets to create the game schedule. Everyone would copy it and create their own tab to add their predictions. Scoring was calculated using VLOOKUPS and MATCH functions, and as you can probably guess, creating and maintaining that solution was complex, especially considering the varying number of participants.
As a leading data company, we are always eager to try new things, so I decided to ditch the Google Sheets solution. Instead, I created a more flexible, maintainable, and visually appealing solution by utilizing Streamlit and Snowflake. I have gathered here all the information on how you can create the following application by yourself and added a few thoughts on what works now and what doesn't.
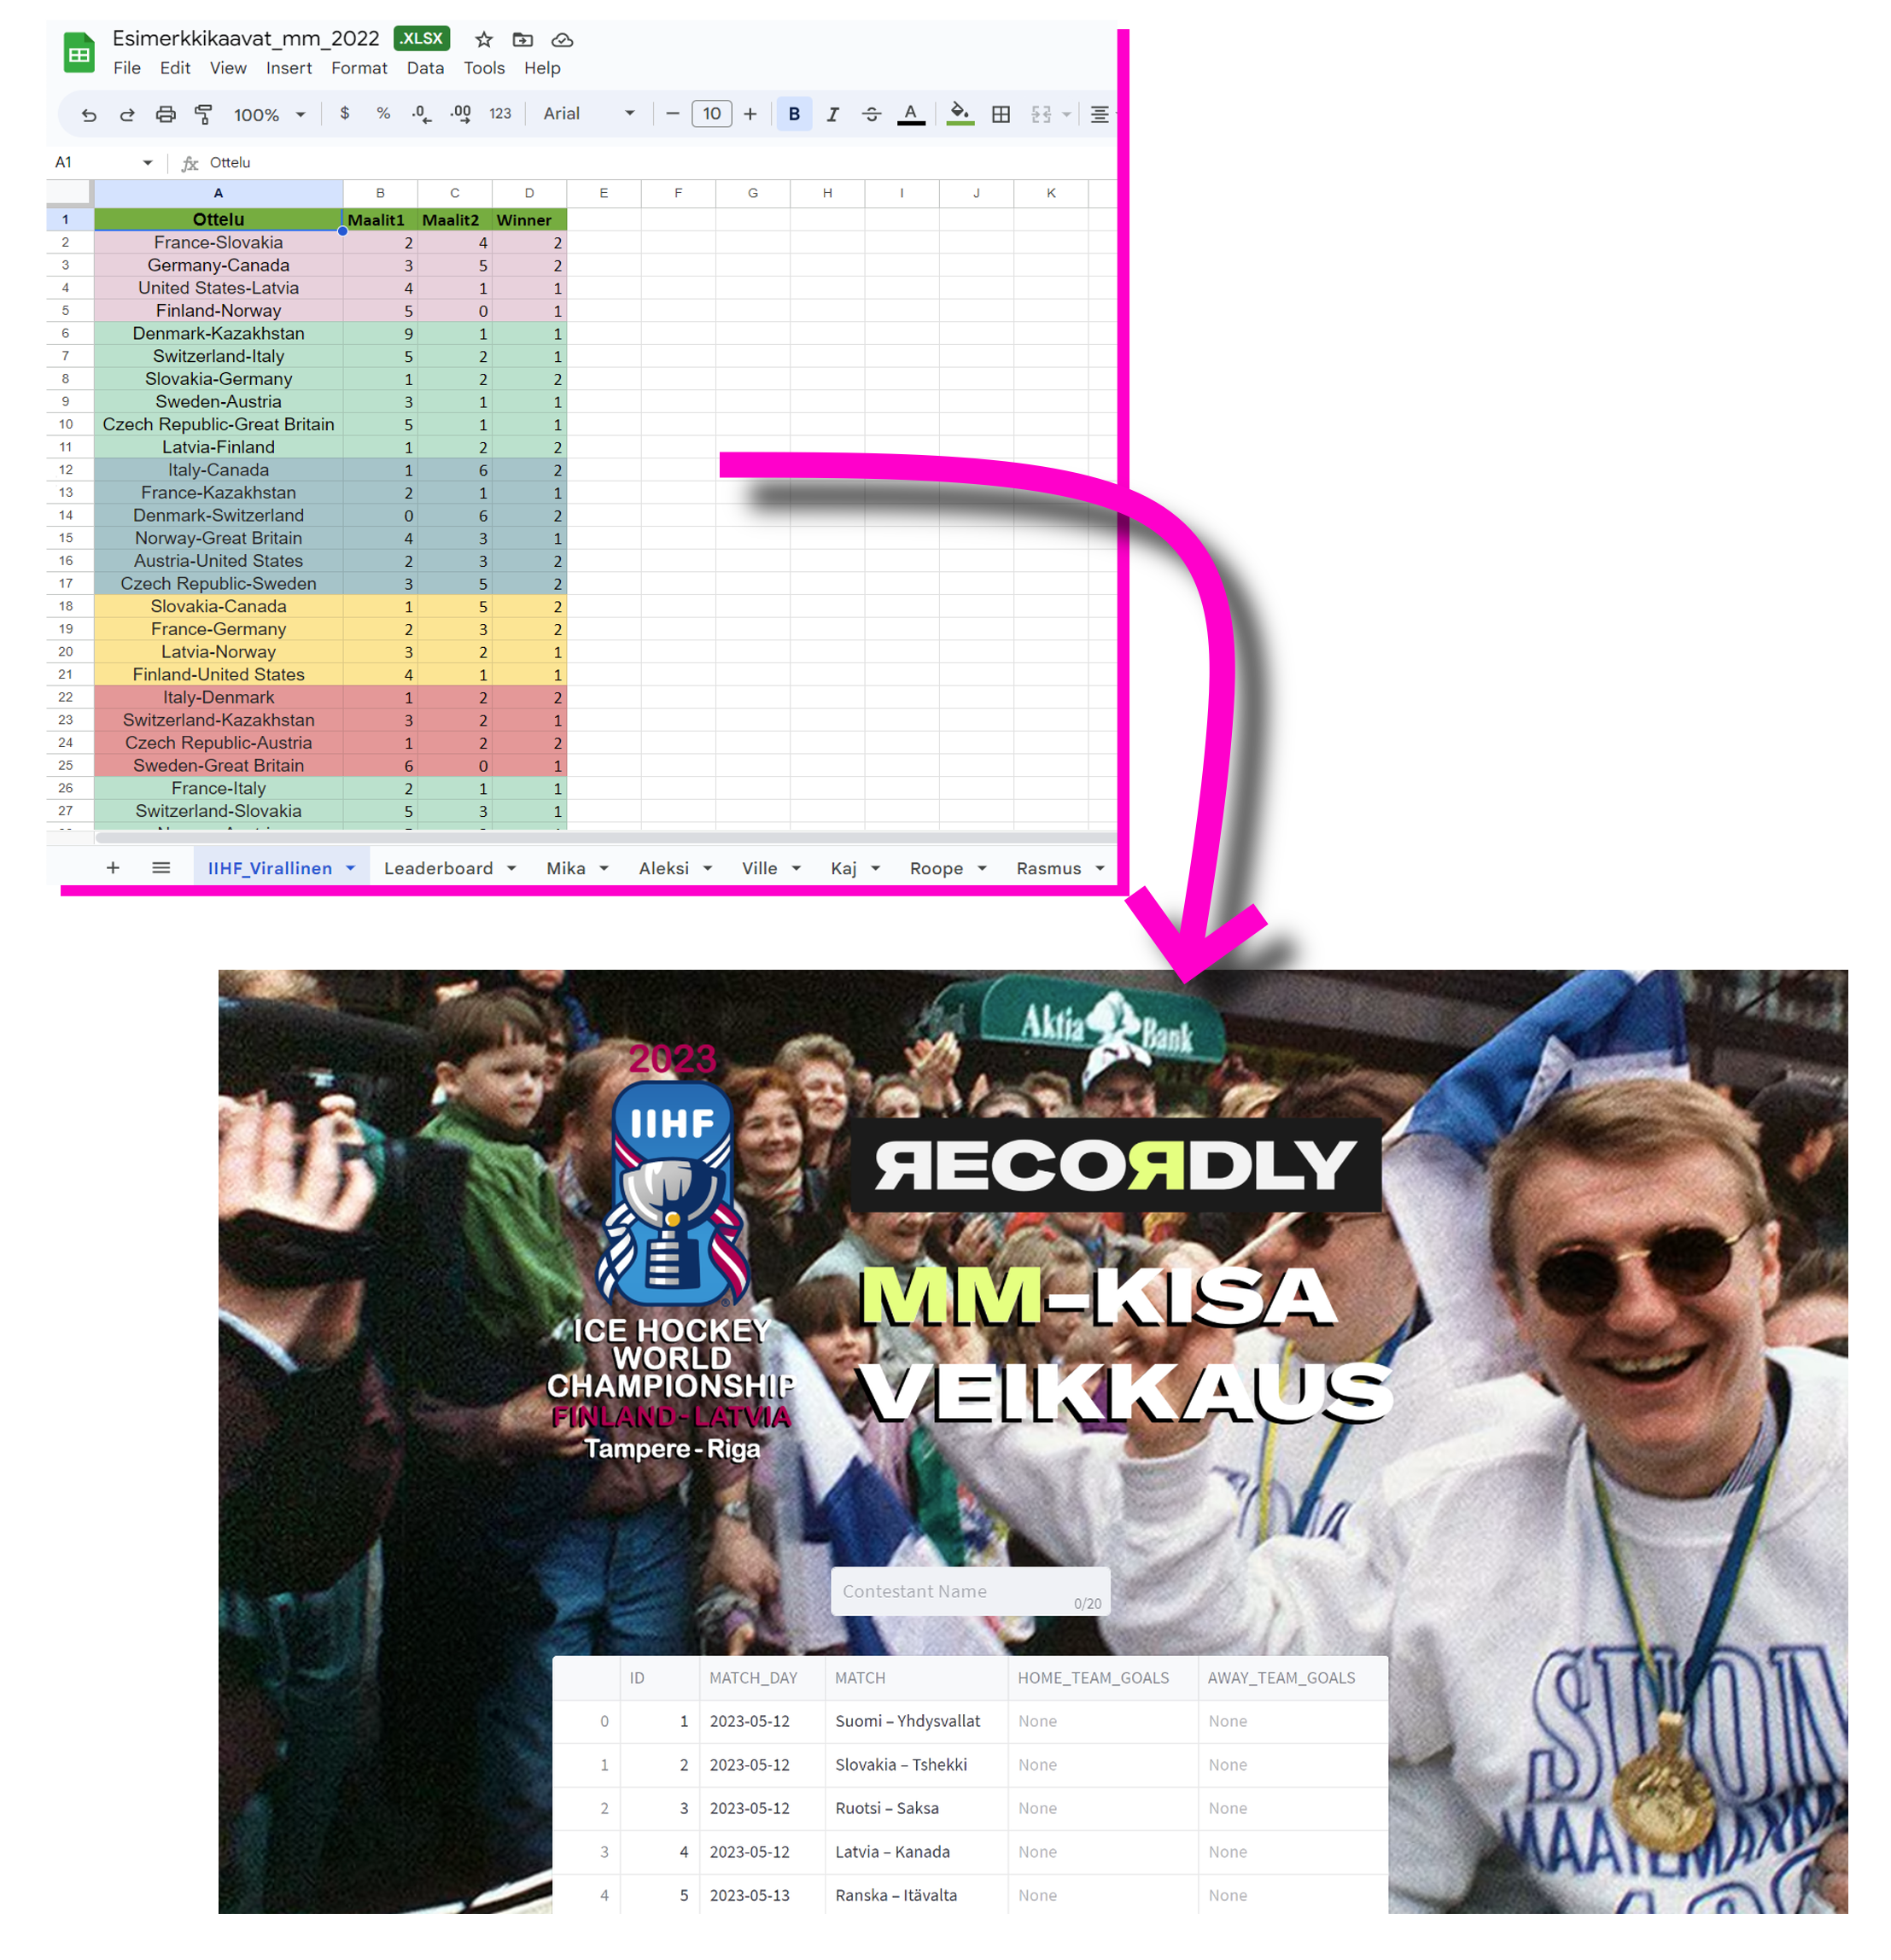
The before and after pictures
How to create the following Streamlit application
The entire code for the application is available on my GitHub account but let me explain the main features here.
- First, we need a place to store the game schedule and users' predictions. To accomplish this, I have set up a database, schema, table, and user to retrieve the data from our internal Snowflake account. Retrieving the data into the Streamlit application is quite simple, but creating an application that handles caching well has required Streamlit developers to understand how and when to use st.cache and st.cache_data decorators. Fortunately, this will change in the future with the introduction of a new connection method, which allows you to establish a connection to Snowflake and other supported databases in just four lines of code, and the new connection method will handle the necessary caching. You can read more about this on the Streamlit blog: https://blog.streamlit.io/introducing-st-experimental_connection/
# This defines Snowflake connection settings, set in Streamlit config.toml fileif 'snowflake_connection' not in st.session_state:st.session_state.snowflake_connection = Session.builder.configs(st.secrets.snowflake).create()session = st.session_state.snowflake_connectionelse:session = st.session_state.snowflake_connection# Function to get blank dataset from Snowflakedef get_blank_dataset():# load messages dfdf = session.table("MM_KISAVEIKKAUS_SCHEDULE")return df - Once we've established a connection to Snowflake, we need to fetch the data into an editable dataframe. This process is similar to loading data into a regular dataframe, except that you must indicate whether end-users can add new rows with num_rows -option. Once the data is loaded, users can modify the rows and values freely, as the session state will handle the rest. To simplify saving the data back to Snowflake, I wrapped the entire dataframe in an st.form. This allows us to push all the data as a batch for further processing, using the st.form_submit_button.
# Let's get empty schedule from Snowflake
# and load that into form with has the experimental data editor
# We define num_rows to fixed as we do not want to
# mess with the amount of rows
dataset=get_blank_dataset()

with st.form("data_editor_form"):
        edited = st.experimental_data_editor(dataset, width=1500, height=2000, use_container_width=False, num_rows="fixed")
        col1, col2 = st.columns(2)
        with col1:
                st.empty()
        with col2:
submit_button = st.form_submit_button("Save as new") - The last step involves creating functionality to save the edited dataframe back into Snowflake. This is done by using the batch data and saving it into Snowflake using the session.write_to_pandas command. The overwrite command is used intentionally in this process and as write_pandas -supports auto_table -creation, we don't create the table beforehand. The pandas DataFrame command .isin is used to ensure that the values inputted in the form are between 0 - 14 (these are basically the allowed number of goals).
if submit_button:

    home_team_values = edited['HOME_TEAM_GOALS'].isin(['0','1','2','3','4','5','6','7','8','9','10','11','12','13','14'])

    if home_team_values.all():

        away_team_values = edited['AWAY_TEAM_GOALS'].isin(['0','1','2','3','4','5','6','7','8','9','10','11','12','13','14'])

        if away_team_values.all():

            try:
                    prediction = contestant + "_MM_KISAVEIKKAUS"
                    # Write to database
                    session.write_pandas(edited, prediction, auto_create_table=True, overwrite=True)
                    header('Predictions have been added')

            except:
                st.warning("Error updating table")
                #display success message for 5 seconds and update the table to reflect what is in Snowflake
                st.experimental_rerun()
        else:
            header('Missing away game predictions')

    else:
        header('Missing home game predictions')
The final result looks like this. The video demonstrates another feature of the app, the ability to overwrite the previous prediction.
Getting data from Snowflake, modifying it inside an editable dataframe, and writing the result back to Snowflake
What works In Streamlit editable dataframes?
As you can see from the amount of code, creating a Google Sheets-like experience doesn't require much code. The implementation is straightforward because you don't need to define columns or data types beforehand. If you know how to operate with dataframes and Streamlit, you already know how to use editable dataframes. Most of my time on this Streamlit application was spent on everything else, from creating the database schemas to designing the graphics.
What doesn't (yet) work?
The editable dataframes are currently in early development and are expected to have many new features added in the future. As the aim of editable dataframes is to replace the need for spreadsheets, it is essential to provide users with the necessary features for a proper Excel replacement. Fortunately, most of the needed features are already listed on the Streamlit Github, including:
- Individual column editing
- Excel-like sorting and filtering features for columns
- More styling options for dataframes
- The ability to have hierarchical headers
- An easier way to create undo functionality to handle mistakes (you can do something with st.session_state already)
Recap
Streamlit's new editable dataframes feature provides users with a table-like interface to manipulate data directly. Although this feature offers convenience and simplicity, it still has some limitations that need to be addressed. These include possible performance issues when working with larger datasets, and the user experience may not be as smooth as with Google Sheets and Excel.
Despite these limitations, editable dataframes can already be used in various applications, such as data exploration and prototyping. They are particularly useful for small to medium-sized datasets, especially in situations where changes to the data need to be made quickly and easily. As development progresses, editable dataframes will become an even more powerful tool for data analysis and management.
Did you enjoy the article? In creating this blog, I utilized various tools such as Streamlit for developing the showcase application, Blender for video editing, and even modified images from my and my brother's old 1993-94 SISU HOCKEY Cardset using Paint+ (yes, really). At Recordly, we encourage the use of any necessary tools to expand your knowledge and enhance your creative freedom.
We are currently seeking talented data engineers and data architects to join our amazing team of data professionals! Learn more about us and apply below 👇